

Table of Contents
Introduction:
Java memory management is a crucial aspect of developing efficient and high-performing applications. Unlike some other programming languages that require manual memory allocation and deallocation, Java relies on an automatic memory management system known as garbage collection.
This feature not only simplifies the development process but also helps prevent memory leaks and ensures optimal resource utilization. However, understanding how Java manages memory is essential for writing robust and scalable applications, particularly in resource-constrained environments or scenarios involving long-running processes.
In this comprehensive guide, we’ll dive deep into the intricacies of Java’s memory management, exploring various aspects such as the memory model, garbage collection mechanisms, heap memory configurations, and best practices for efficient memory utilization. Whether you’re a Java novice or an experienced developer, this blog post will equip you with the knowledge and insights needed to master memory management in the Java ecosystem.
Java Memory Model: A Bird’s Eye View
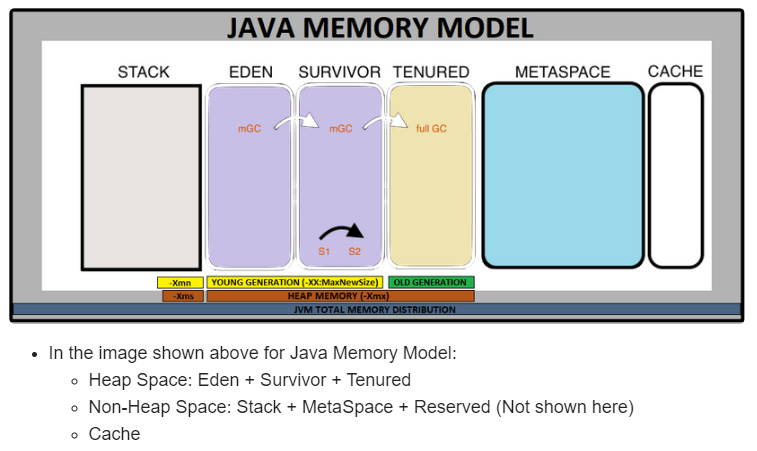
Image Credits: https://itzsrv.com/java-memory-model/
Before delving into the specifics of Java’s memory management, it’s essential to understand the Java Memory Model (JMM). The JMM defines how Java programs interact with memory, ensuring that variables are consistently updated and visible across multiple threads. It consists of several components, including:
- Heap Memory: The heap is a shared area of memory used for dynamically allocating objects and instances of classes. It’s managed automatically by the Java Virtual Machine (JVM) and is divided into different generations, which we’ll explore later.
- Stack Memory: Each thread in a Java program has its stack memory, which is used for storing method calls, local variables, and other short-lived data structures. Unlike the heap, the stack memory is managed directly by the JVM, and objects stored here are automatically deallocated when a method completes its execution.
- Metaspace (or Permanent Generation in older Java versions): This area of memory stores metadata related to classes and other runtime data structures. In Java 8 and later versions, the Metaspace replaced the Permanent Generation (PermGen) and is designed to grow automatically as needed, reducing the risk of out-of-memory errors caused by limited PermGen space.
- Native Memory: Java programs can interact with native (non-Java) code through the Java Native Interface (JNI). The native memory is used for storing data structures and objects related to these native components.
Understanding Garbage Collection
One of the most significant advantages of Java memory management is automatic garbage collection. The garbage collector (GC) is a component of the JVM responsible for identifying and reclaiming memory occupied by objects no longer in use. This process is crucial for preventing memory leaks and ensuring efficient memory utilization.
Garbage collection in Java is based on the concept of reachability. An object is considered “reachable” if it can be accessed directly or indirectly from a root object, such as a static variable, a currently executing thread, or a currently loaded class. Objects that are not reachable are considered “garbage” and are eligible for collection by the garbage collector.
The garbage collection process typically involves the following steps:
- Mark: The garbage collector identifies all reachable objects by starting from the root objects and following references to other objects. This phase is known as “marking.”
- Delete: After identifying the unreachable objects, the garbage collector reclaims the memory occupied by these objects, making it available for future allocations. This phase is known as “sweeping” or “compacting.”
- Compact (optional): In some garbage collection algorithms, the surviving objects may be compacted to reduce memory fragmentation and improve memory utilization.
Garbage Collection Algorithms
Java memory management supports various garbage collection algorithms, each with its strengths and trade-offs. The choice of algorithm depends on factors such as application requirements, available memory, and performance considerations. Here are some of the commonly used garbage collection algorithms in Java:
- Serial Garbage Collector: This is the simplest garbage collector and is suitable for single-threaded applications or systems with limited memory resources. It pauses all application threads during the garbage collection process, which can lead to performance degradation in applications with high memory usage or frequent object allocations.
- Parallel Garbage Collector: As the name suggests, this collector utilizes multiple threads to perform garbage collection tasks in parallel. It’s designed for applications running on multi-processor or multi-threaded systems and aims to minimize pause times by utilizing multiple CPU cores.
- Concurrent Mark Sweep (CMS) Collector: The CMS collector is a low-pause garbage collector that performs most of its work concurrently with the application threads. It’s suitable for applications that require short pause times but can tolerate slightly higher overhead due to concurrent operations.
- G1 (Garbage-First) Collector: The G1 collector is a server-style garbage collector introduced in Java 7. It’s designed to provide high throughput and low pause times by dividing the heap into multiple regions and collecting garbage from regions with the most garbage first. G1 is particularly well-suited for applications with large memory footprints and strict pause time requirements.
- Shenandoah and ZGC: These are two recently introduced low-pause garbage collectors in OpenJDK. Shenandoah is designed for concurrent compaction and supports a wide range of workloads, while ZGC (Z Garbage Collector) is optimized for low latency and high throughput, making it suitable for real-time and low-latency applications.
Choosing the right garbage collector depends on various factors, such as application requirements, available hardware resources, and performance goals. Java provides options to configure and tune the garbage collector to suit specific needs.
Heap Memory Generations
In Java memory management heap memory is divided into different generations, each with its own characteristics and garbage-collection strategies. Understanding these generations is crucial for optimizing memory usage and performance.
- Young Generation: This generation is where newly created objects reside. It’s further divided into two sub-generations:
- Eden Space: This is where new objects are initially allocated.
- Survivor Spaces: These are two separate areas (Survivor 1 and Survivor 2) where objects that survive a minor garbage collection are temporarily stored.
- Old Generation (Tenured Generation): Objects that survive multiple rounds of minor garbage collection in the young generation are promoted to the old generation. This generation typically holds long-lived objects and is subject to less frequent but more expensive major garbage collections.
Minor Garbage Collection
Minor garbage collection, also known as a young generation collection, focuses on the young generation. It’s a relatively inexpensive process that occurs frequently to reclaim memory occupied by short-lived objects. During a minor GC, the following steps occur:
- All references from the old generation to the young generation are identified.
- The Eden space and one of the survivor spaces (e.g., Survivor 1) are scanned for reachable objects.
- Reachable objects from the Eden space are copied to the other survivor space (e.g., Survivor 2).
- Reachable objects from the survivor space (e.g., Survivor 1) that are still relatively young are also copied to the other survivor space (e.g., Survivor 2).
- The Eden space and the survivor space (e.g., Survivor 1) are cleared, and the roles of the survivor spaces are swapped for the next minor GC cycle.
👉 Objects that survive multiple rounds of minor GCs are eventually promoted to the old generation.
Major Garbage Collection
Major garbage collection, also known as a full GC, focuses on the old generation. It’s a more expensive process that occurs less frequently than minor GCs but is necessary to reclaim memory occupied by long-lived objects. During a major GC, the following steps occur:
- All application threads are paused (stop-the-world event).
- The entire heap, including the young and old generations, is scanned to identify reachable objects.
- Unreachable objects in the old generation are reclaimed.
- Optionally, a compaction phase may occur to defragment the heap and improve memory utilization.
Major GCs can introduce significant pause times, especially in applications with large memory footprints or complex object graphs. To minimize the impact of major GCs, it’s essential to optimize memory usage and monitor the garbage collector’s performance.
Java Heap Memory Switches
Java provides several command-line switches to configure and tune the heap memory settings. Understanding these switches is crucial for optimizing memory usage and performance in your Java applications.
- -Xms (Initial Heap Size): This switch sets the initial size of the Java heap memory. It’s recommended to set this value based on your application’s memory requirements to avoid unnecessary memory consumption or performance degradation due to frequent garbage collections.
- -Xmx (Maximum Heap Size): This switch specifies the maximum size of the Java heap memory. Setting an appropriate value for this switch is essential to prevent out-of-memory errors while ensuring that your application has enough memory to operate efficiently.
- Heap Dump Analysis: In cases where memory leaks or excessive memory usage are suspected, heap dumps can be generated and analyzed to identify the root causes. Tools like Eclipse Memory Analyzer Tool (MAT) and Java VisualVM can be used to analyze heap dumps and identify objects consuming excessive memory.
- JVM Arguments and Flags: Java provides numerous command-line arguments and flags to fine-tune the garbage collector’s behaviour. Some commonly used flags include
-XX:+UseParallelGC,-XX:ParallelGCThreads,-XX:MaxGCPauseMillis, and-XX:+ExplicitGCInvokesConcurrent, among others. Careful tuning of these flags can help optimize garbage collection performance for specific application requirements. - Concurrent Mark and Sweep (CMS) Tuning: CMS is a low-pause garbage collector that performs most of its work concurrently with application threads. However, it requires careful tuning to achieve optimal performance. Flags like
-XX:+UseConcMarkSweepGC,-XX:+CMSIncrementalMode, and-XX:+CMSClassUnloadingEnabledcan be adjusted to fine-tune CMS behaviour. - G1 Garbage Collector Tuning: The G1 garbage collector is designed for low pause times and high throughput, but it also requires tuning for optimal performance. Flags like
-XX:+UseG1GC,-XX:G1HeapRegionSize, and-XX:MaxGCPauseMilliscan be used to configure G1’s behaviour.
Practical Examples
To demonstrate various concepts of Java memory management, including heap memory, garbage collection, and different memory areas, you can create a simple Java program that showcases these aspects. Here’s an example program that you can use and adapt for your blog post:
import java.util.ArrayList;
import java.util.List;

public class MemoryManagementDemo {
    public static void main(String[] args) {
        // Demonstrate stack memory
        int localVariable = 42;
        System.out.println("Local variable (stack): " + localVariable);

        // Demonstrate heap memory and garbage collection
        List<Object> objects = new ArrayList<>();
        for (int i = 0; i < 10000000; i++) {
            objects.add(new Object());
        }
        System.out.println("Number of objects created: " + objects.size());
        System.gc(); // Request garbage collection
        System.out.println("After garbage collection: " + objects.size());

        // Demonstrate Metaspace (or PermGen in older Java versions)
        int classCount = 10000;
        List<Class<?>> classes = new ArrayList<>();
        for (int i = 0; i < classCount; i++) {
            classes.add(MemoryManagementDemo.class.getClassLoader().defineClass(
                    "DynamicClass" + i,
                    new byte[0],
                    0,
                    0
            ));
        }
        System.out.println("Number of classes loaded: " + classes.size());

        // Demonstrate native memory
        long addressValue = allocateNativeMemory();
        System.out.println("Native memory address: " + addressValue);
        freeNativeMemory(addressValue);
    }

    private static native long allocateNativeMemory();
    private static native void freeNativeMemory(long address);

    static {
        System.loadLibrary("MemoryManagementDemo");
    }
}
This program demonstrates the following aspects of Java memory management:
- Stack Memory: This
localVariableis an example of a variable stored on the stack. - Heap Memory and Garbage Collection: The program creates a large number of
Objectinstances on the heap and then requests garbage collection usingSystem.gc(). After garbage collection, the size of theobjectslist should be smaller, as the unreferenced objects are removed. - Metaspace (or PermGen): The program dynamically loads a large number of classes using
defineClass(). These classes are stored in the Metaspace (or PermGen in older Java versions). - Native Memory: The program demonstrates the use of native memory by allocating and freeing a native memory address using JNI (Java Native Interface) methods. Note that you’ll need to provide the implementation of the native methods (
allocateNativeMemory()andfreeNativeMemory()) in a separate C/C++ file and compile it into a shared library.
To run this program, you’ll need to compile the Java code and create a shared library for the native methods. The specific steps for compiling and running the program may vary depending on your operating system and development environment.
Please note that this program is intended for educational and demonstration purposes only. It may consume a significant amount of memory, so it’s recommended to run it in a controlled environment or with appropriate memory limits.
Feel free to modify and extend this program to showcase additional aspects of Java memory management or to align it with specific examples.
Best Practices for Memory Management
While Java’s automatic memory management relieves developers from the burden of manual memory allocation and deallocation, it’s still essential to follow best practices to ensure efficient memory usage and minimize the impact of garbage collection.
- Object Pooling: Instead of creating and destroying objects frequently, consider implementing object pooling techniques. Object pooling involves creating a pool of reusable objects, which can significantly reduce the overhead of object creation and garbage collection.
- Avoid Premature Optimization: While it’s important to write efficient code, premature optimization can often lead to unnecessary complexity and performance bottlenecks. Focus on writing clean, readable code first, and optimize only when necessary, based on profiling data and performance analysis.
- Understand Memory Leaks: Memory leaks occur when objects are no longer needed but remain reachable, preventing the garbage collector from reclaiming their memory. Understanding common causes of memory leaks, such as static references, listener objects, and unclosed resources, can help you avoid these issues.
- Use Memory-Efficient Data Structures: Choosing the right data structures can have a significant impact on memory usage and performance. For example, instead of using large arrays or collections, consider using more memory-efficient alternatives like primitive data types or specialized collections when appropriate.
- Finalize Cautiously: The
finalize()method in Java is called by the garbage collector before an object is reclaimed. However, overusing or misusing this method can lead to performance issues and unexpected behavior. Usefinalize()sparingly and only when absolutely necessary. - Monitor and Tune: Regularly monitor your application’s memory usage, garbage collection performance, and potential memory leaks. Use the available tools and techniques to analyze and tune the garbage collector based on your application’s specific requirements and workloads.
- Consider Memory-Efficient Alternatives: In scenarios where memory usage is critical, such as embedded systems or resource-constrained environments, consider using memory-efficient alternatives to the Java Virtual Machine (JVM), such as Android Runtime (ART) or Azul’s Zing JVM.
- Stay Updated: Java’s memory management and garbage collection algorithms are continuously evolving. Stay informed about the latest developments, updates, and best practices related to memory management in Java.
Conclusion
Java’s automatic memory management, powered by its garbage collection system, is a powerful feature that simplifies development and helps prevent memory leaks. However, understanding the intricacies of Java’s memory model, heap generations, garbage collection algorithms, and tuning options is crucial for optimizing performance and ensuring efficient memory utilization.
In this comprehensive guide, we explored the fundamental concepts of Java’s memory management, including the memory model, garbage collection mechanisms, heap memory configurations, and best practices for efficient memory usage. By applying the knowledge and techniques discussed in this blog post, you can write more robust, scalable, and high-performing Java applications that effectively manage memory resources.
Remember, while Java’s automatic memory management relieves developers from the burden of manual memory allocation and deallocation, it’s still essential to follow best practices, monitor memory usage, and tune the garbage collector based on your application’s specific requirements. Continuous learning and staying updated with the latest developments in Java’s memory management ecosystem is key to maintaining efficient and optimized applications.
